julia.py: Generate Julia and Mandlebrot Set Images from the Command Line!
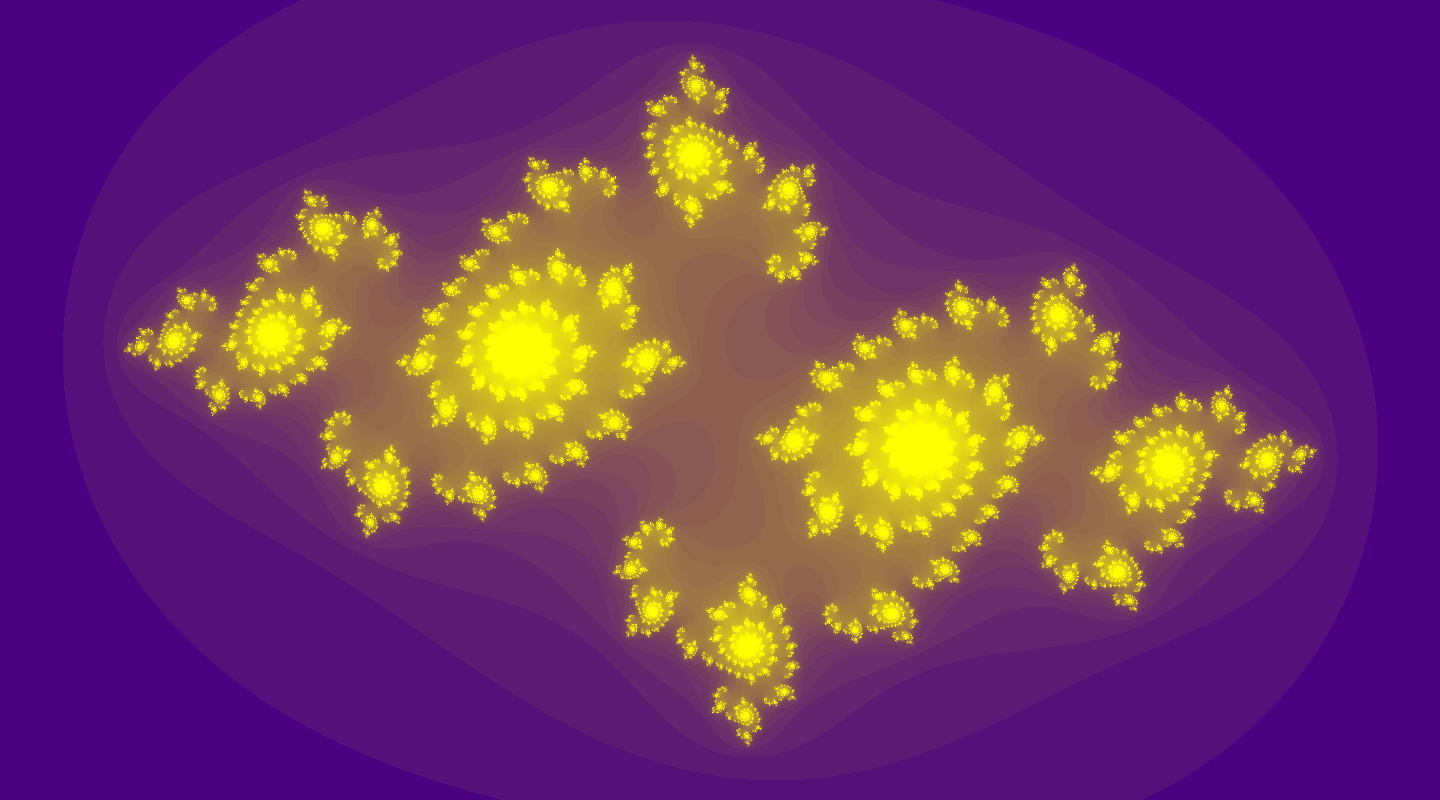
julia.py is a command-line tool for generating images of Julia and Mandelbrot sets. Here's an example:
$ python ./julia.py "z*z - 0.75 + 0.25j" 1440 800 --levels 50 --gamma 0.7 --zoom 1.1 --colors indigo yellow
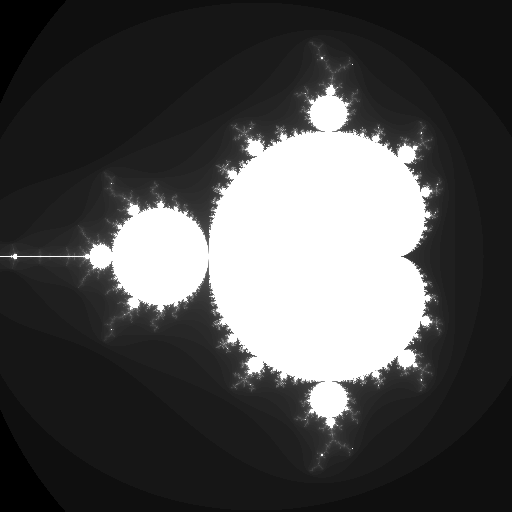
Using the --Mandelbrot option, you can also make images of Mandelbrot
sets.
$ ./julia.py --Mandelbrot "z**2" 512 512 --center "(-0.5+0.0j)" --zoom 1.5 --gamma 0.5
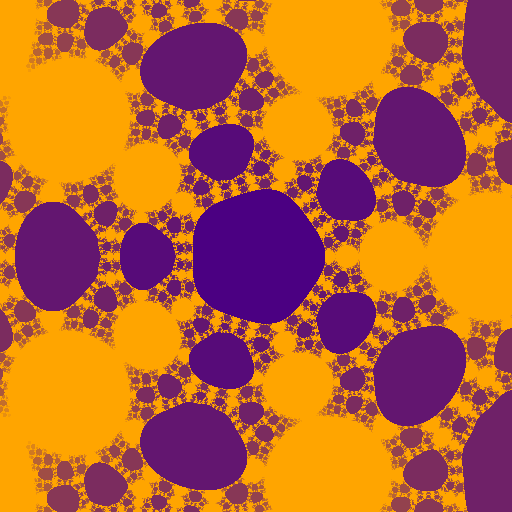
One of the coolest things about julia.py is that you can pass it any
function to iterate, as long as it's a valid mathematical expression in
terms of variable z;
cmath functions are
supported.
$ ./julia.py "(1 + 4*z**5)/(7*z**4)" 512 512 --levels 16 -colors indigo orange
One gotcha is that julia.py will cut off iteration once the absolute magnitude of $z$ exceeds 2, but $\lVert z\rVert > 2$ does not imply that a point will diverge to infinity for arbitrary functions.
Installation
To run julia.py, ensure that you have Python and the Python Imaging
Library (PIL)
installed on your system. Optionally, you can make julia.py executable
using the chmod command.
On Ubuntu:
$ sudo apt install python-pil
$ wget https://gitlab.com/oddloop/julia/raw/master/julia.py
$ chmod +x ./julia.py
A similar set of steps should work on a Mac1. Once julia.py is installed, all of the command-line options can be seen using the help command:
$ ./julia.py --help
usage: julia.py [-h] [-q] [-s FILENAME] [-l [1-256]] [-c BLACK WHITE]
      [-g GAMMA] [-z ZOOM] [-C CENTER] [-M]
      function width height

positional arguments:
  function              f(z) formatted as a Python expression
  width                 width of image in pixels
  height                height of image in pixels

optional arguments:
  -h, --help            show this help message and exit
  -q, --quiet           do not show image
  -s FILENAME, --save FILENAME
          location at which to save image
  -l [1-256], --levels [1-256]
          number of color levels in image
  -c BLACK WHITE, --colors BLACK WHITE
          colors to replace back and white in image
  -g GAMMA, --gamma GAMMA
          gamma correction to apply to image
  -z ZOOM, --zoom ZOOM  zoom factor for the image
  -C CENTER, --center CENTER
          the center of the image in the complex plane as a
          string
  -M, --Mandelbrot      plot a Mandelbrot set instead of a Julia set
Making Video
julia.py is not as full featured as other fractal visualization software, but it is a simple to use from the command line, so it can be easily integrated into shell scripts. Below is an example shell script which composes a video from Julia sets located along the perimeter of the main cardiod of the Mandelbrot set2.
frames=1024
for i in $(seq -w 1 $frames)
do
    theta=$(bc <<< "scale=17;$i*6.283185307179586/$frames")
    ./julia.py "z*z + exp($theta*1j)*(1 - exp($theta*1j)/2)/2" \
               400 400 --colors white indigo --zoom 1.25 \
               --save "./$i.bmp"  --quiet
done
ffmpeg -i %04d.bmp -pix_fmt yuv420p julia.mp4 # requires ffmpeg
The resulting video can be seen here (5.9 MiB). If you do run this script, expect it to take about an hour to complete and to produce a large number of bmp files.
If you try out julia.py, please send me an e-mail with some of the images you made.
-
Installation instructions for PIL on Mac, Windows, and Linux can be found in the Pillow documentation. ↩
-
The perimeter of the cardioid is given in polar coordinates by $r = \frac{1}{2} e^{i\theta}\left(1 - \frac{1}{2} e^{i\theta}\right)$. ↩